Deploy Flink Application [Optional]
Deploy Flink Application
In this module, you’ll convert KDA Studio Notebook into KDA Flink application. This KDA Flink application can be run without a permanently running KDA Studio Notebook, which is usually used to develop and test Flink applications.
Implementation
✅ Step-by-step Instructions
-
Stop your running Flink job in the notebook by clicking Pause icon at the top right corner. you should see
Job cancelledmessage. -
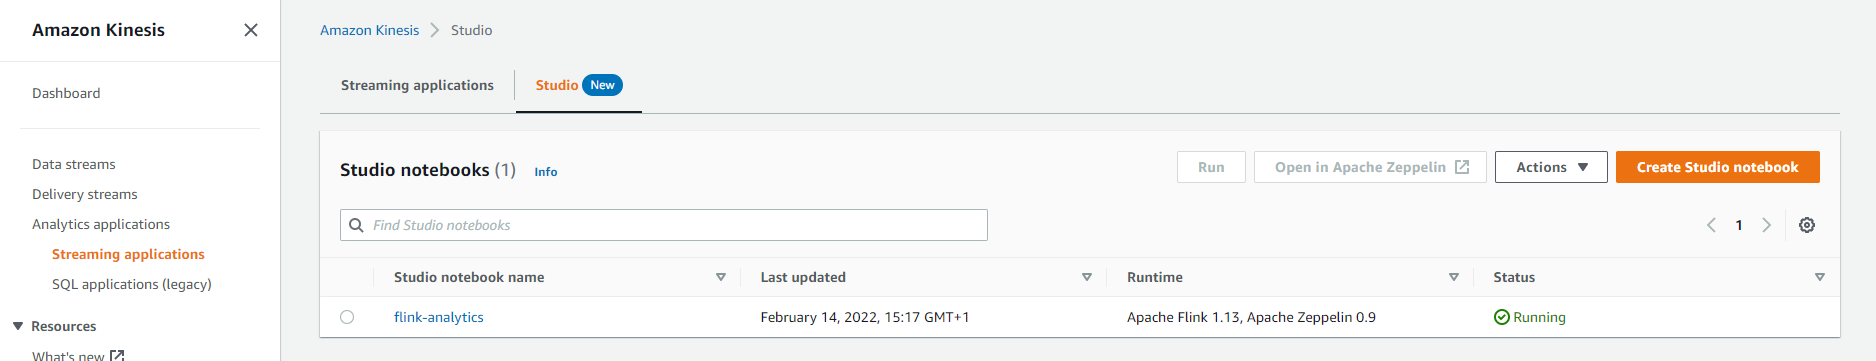
Switch back to the notebook settings page in AWS Console UI and specify S3 bucket to be used for code deployment. To do so, navigate to the Studio tab under Streaming Applications. Click on the notebook name (flink-analytics).
-
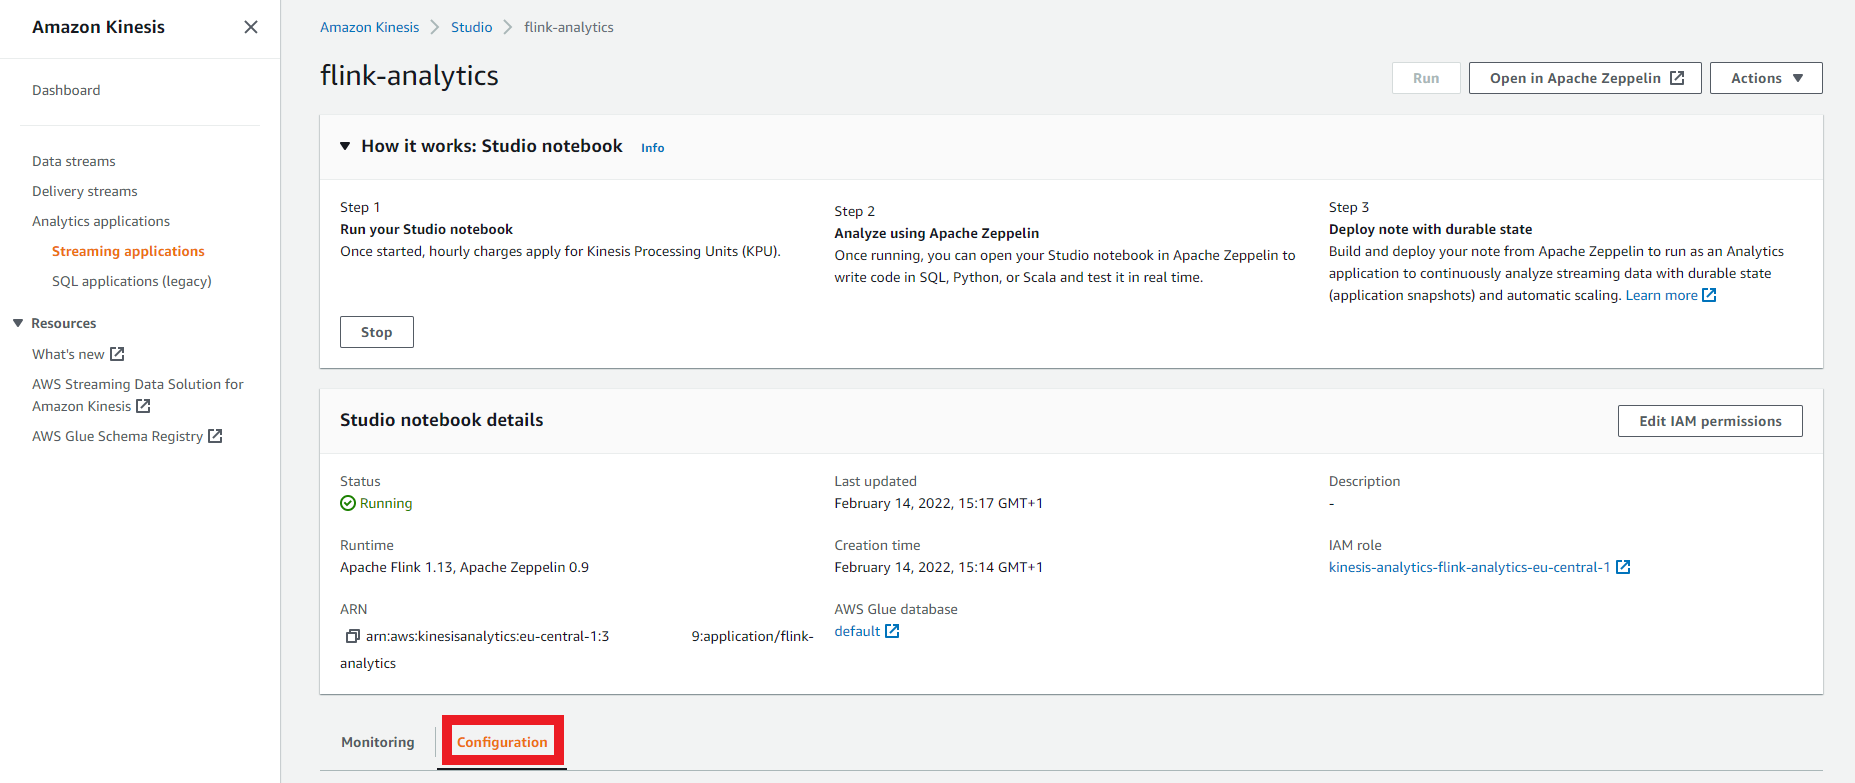
Scroll down and click the Configuration tab below the Studio notebook details pane.
-
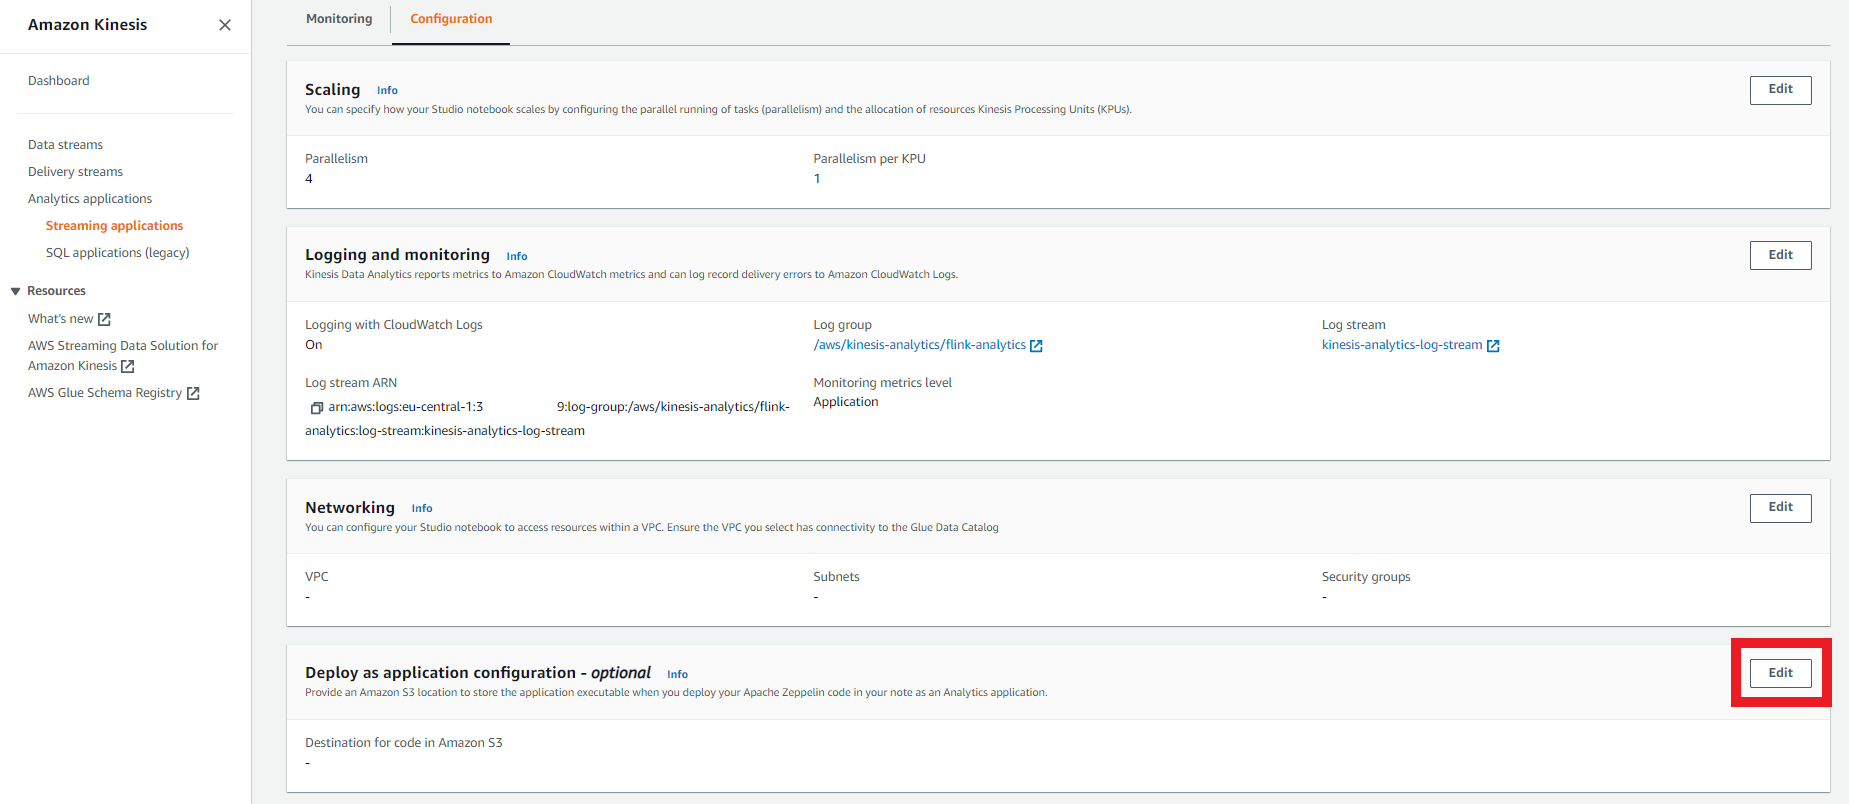
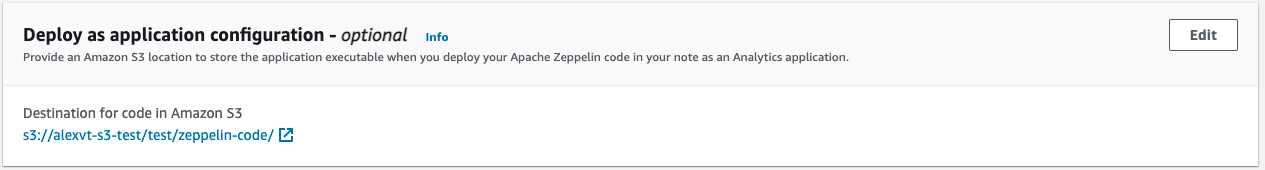
Search for the Deploy as application configuration - optional pane and click Edit.
-
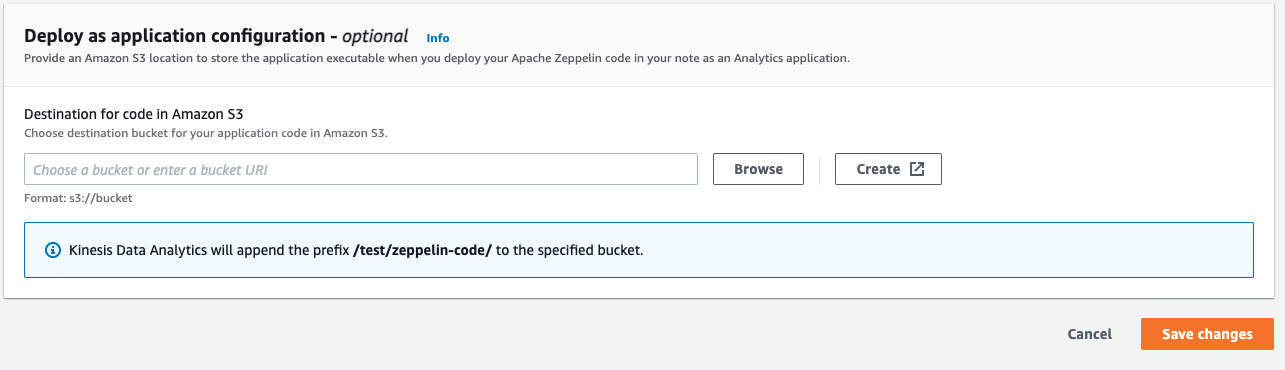
Click Browse to choose S3 bucket. Click Create button if you need to create a new bucket. Click Save changes after making your selection.
-
Your Deploy as application configuration - optional pane should now similar to this:
-
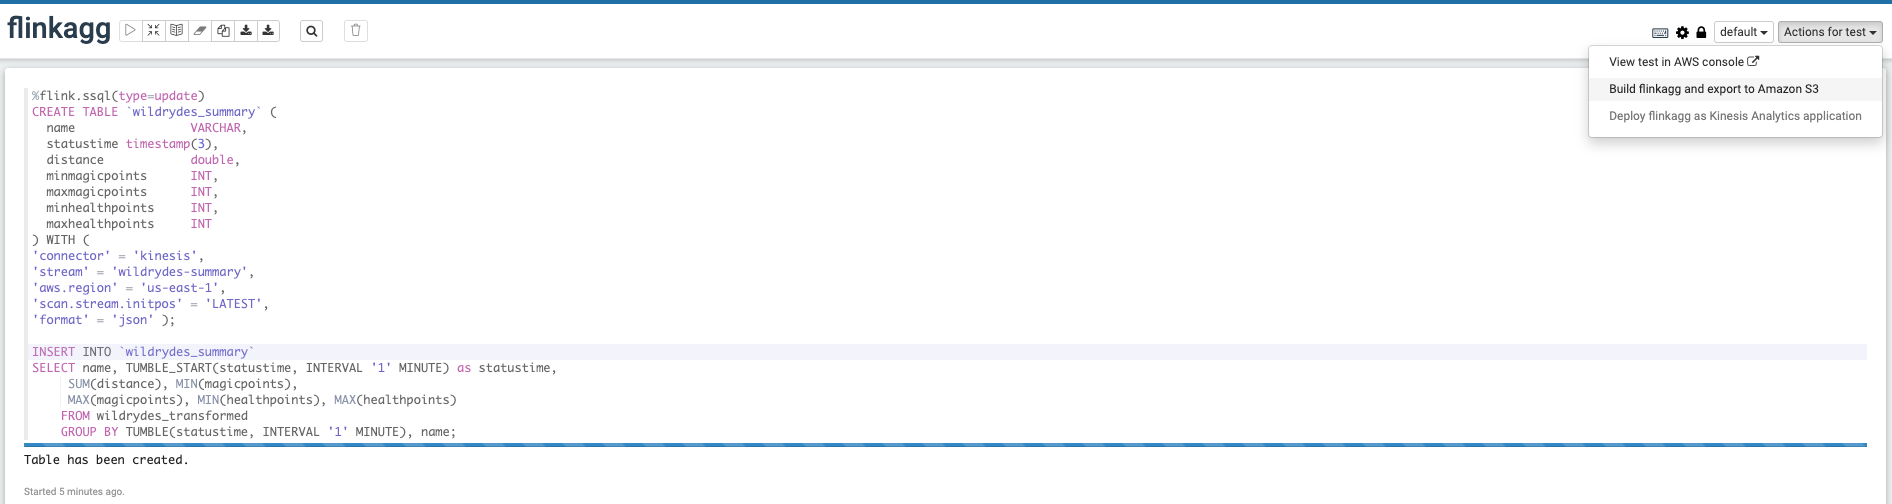
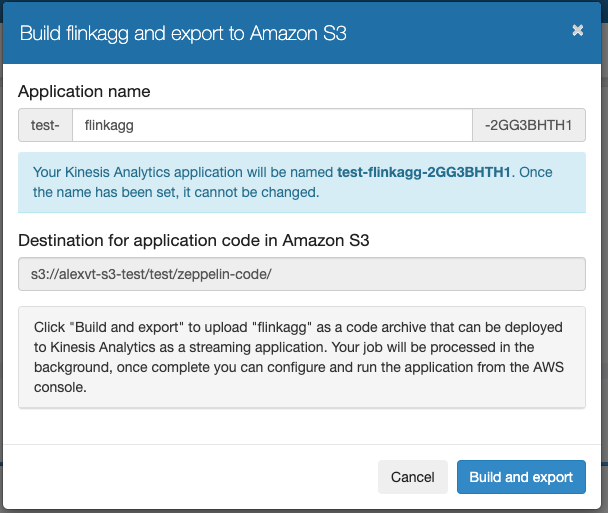
Wait for the notebook to update. This might take some minutes. Now switch back to Zeppelin notebook and select Build and export to Amazon S3
-
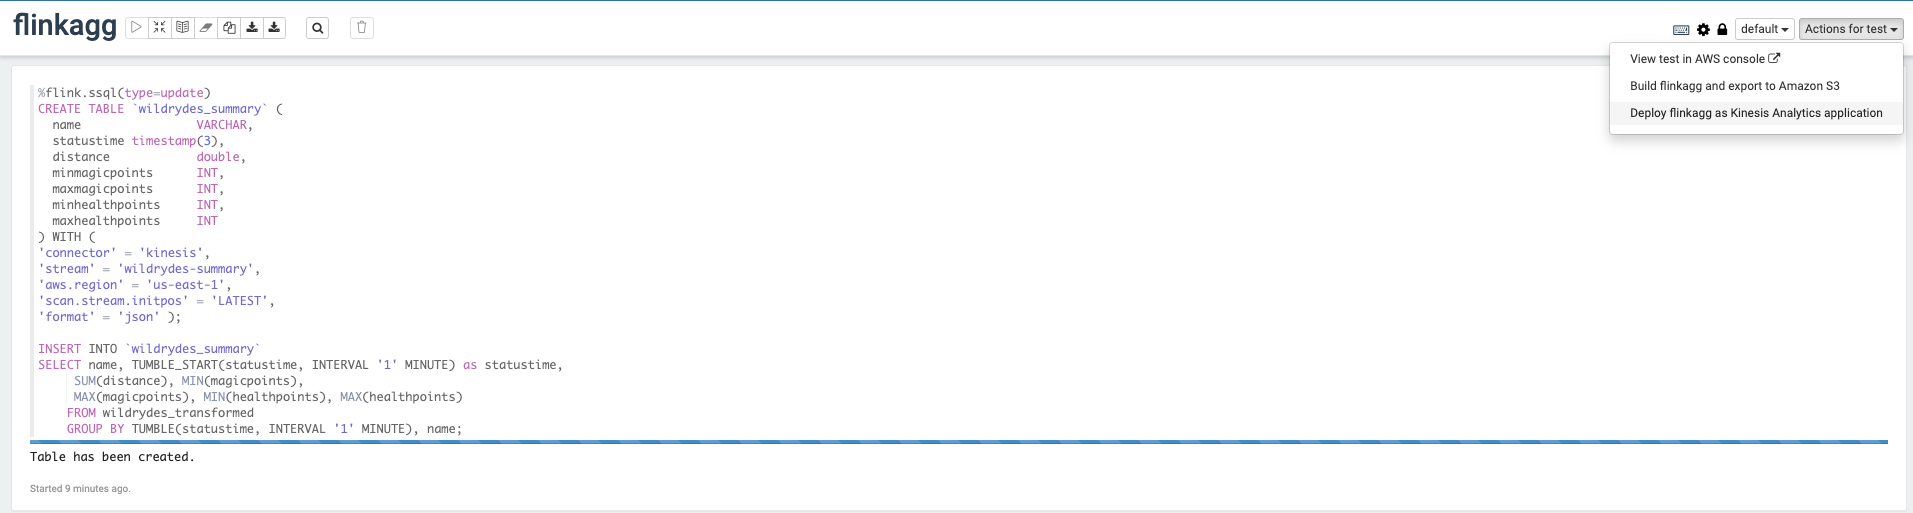
Once the application is built and exported, you should be able to Deploy as Kinesis Application. In the pop up window click build using AWS Console.
-
On Create application page, leave everything selected by default so new IAM role is created and click Create Application button at the bottom of the page.
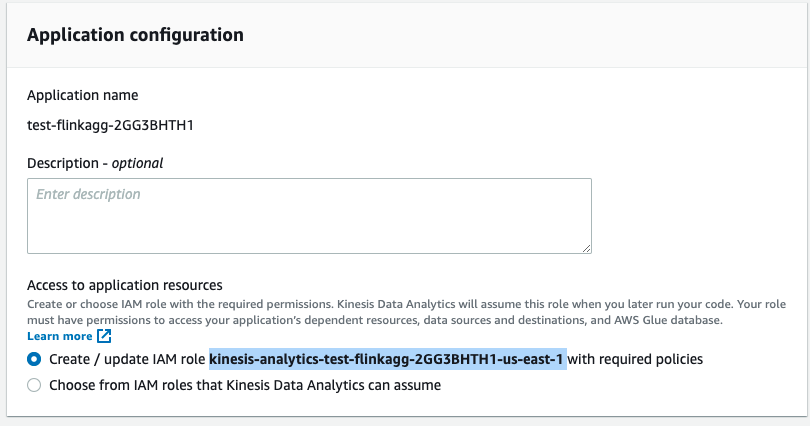
-
Once the application is created, which should take 1-2 minutes, click the IAM role link listed in the Application details pane to add necessary permissions
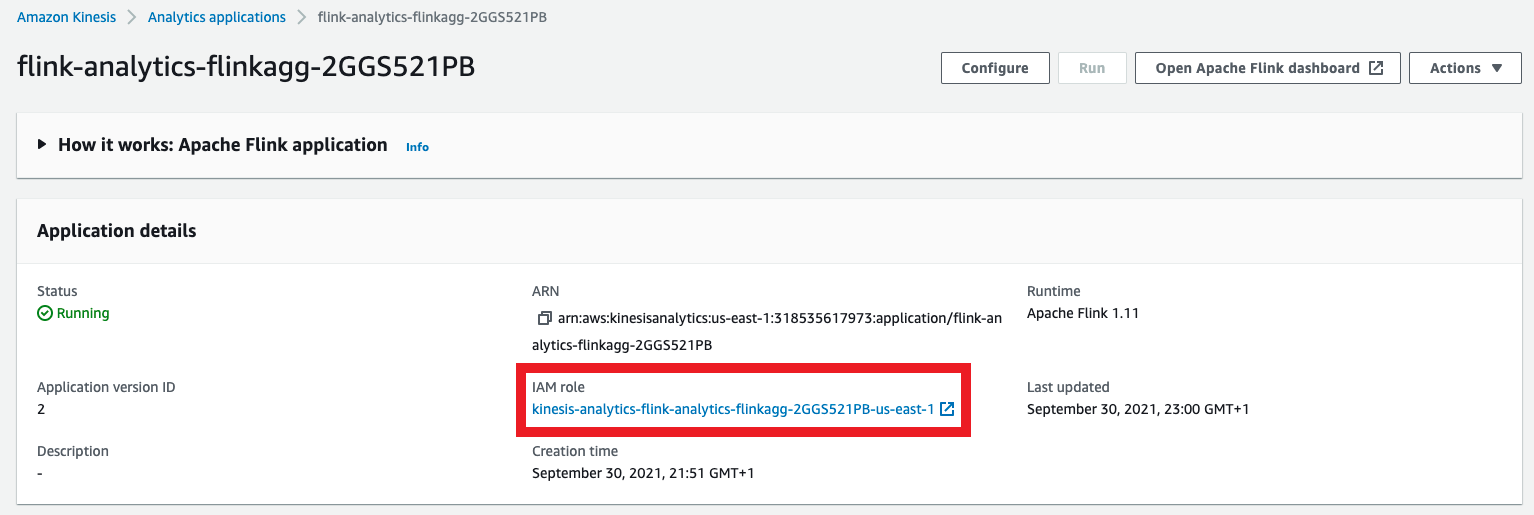
-
You should see an IAM role summary like depicted below:
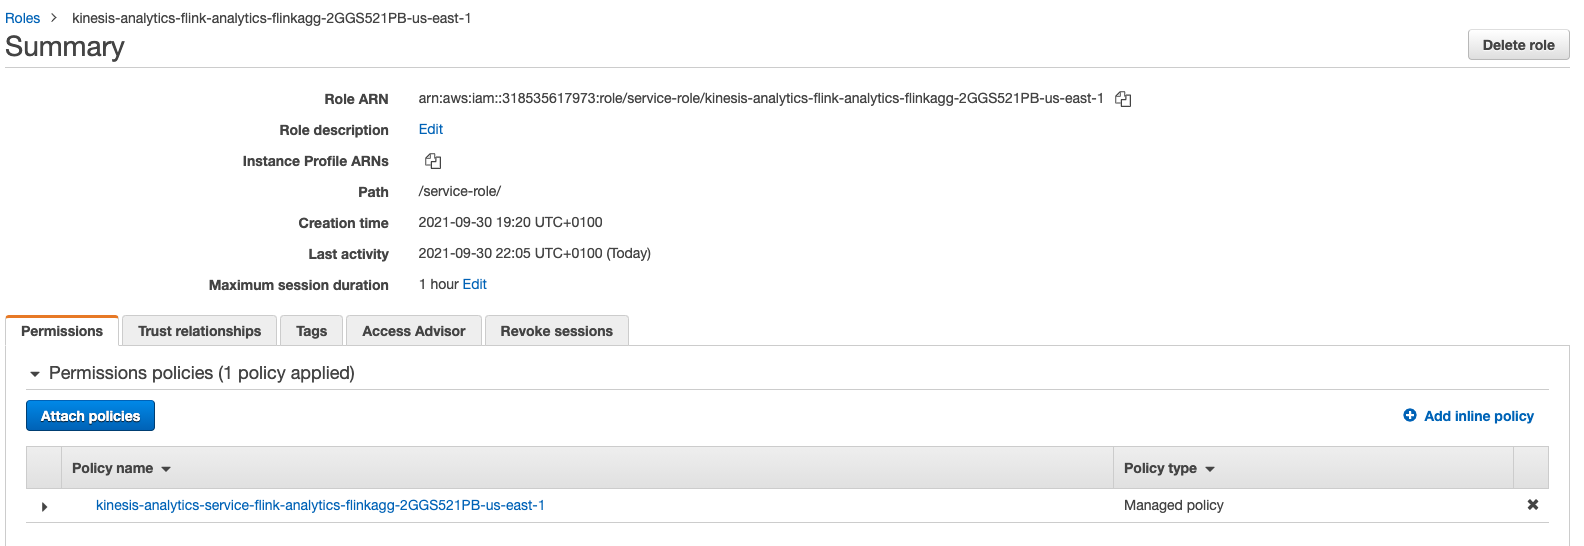
-
Click Add permissions, then Attach policies and choose the 3 policies that were automatically created as a part of KDA Studio notebook role and the managed policy that allowed us to delete Glue tables we have created earlier. Click Attach Policy button at the bottom of the page.
Those policies are
kinesis-analytics-service-<NOTEBOOK_NAME>-p-<REGION>kinesis-analytics-service-<NOTEBOOK_NAME>-pi-<REGION>kinesis-analytics-service-<NOTEBOOK_NAME>-po-<REGION>kinesis-analytics-service-<NOTEBOOK_NAME>-glue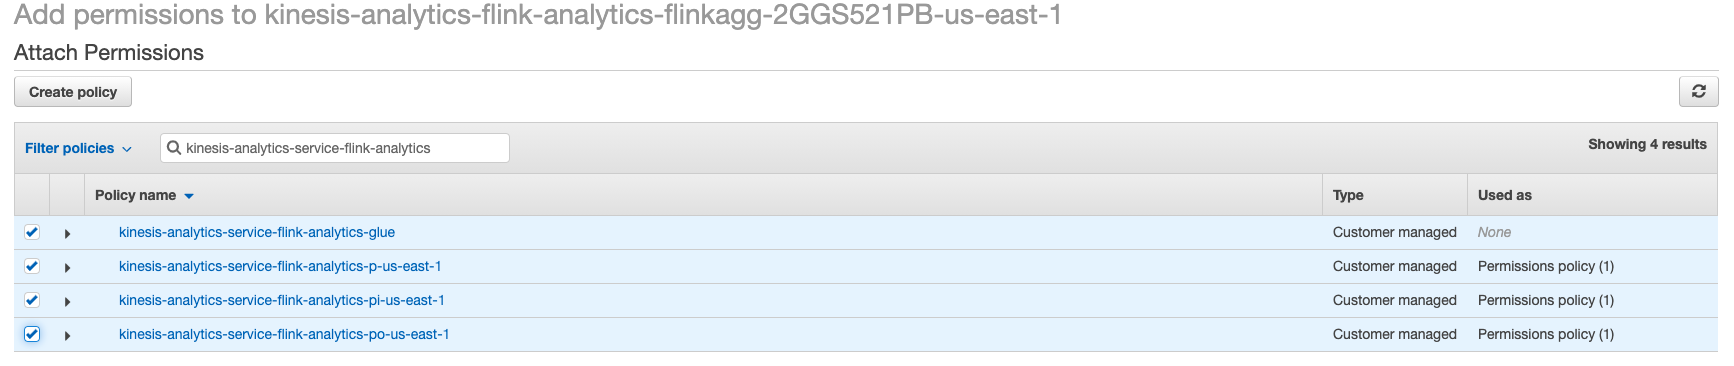
-
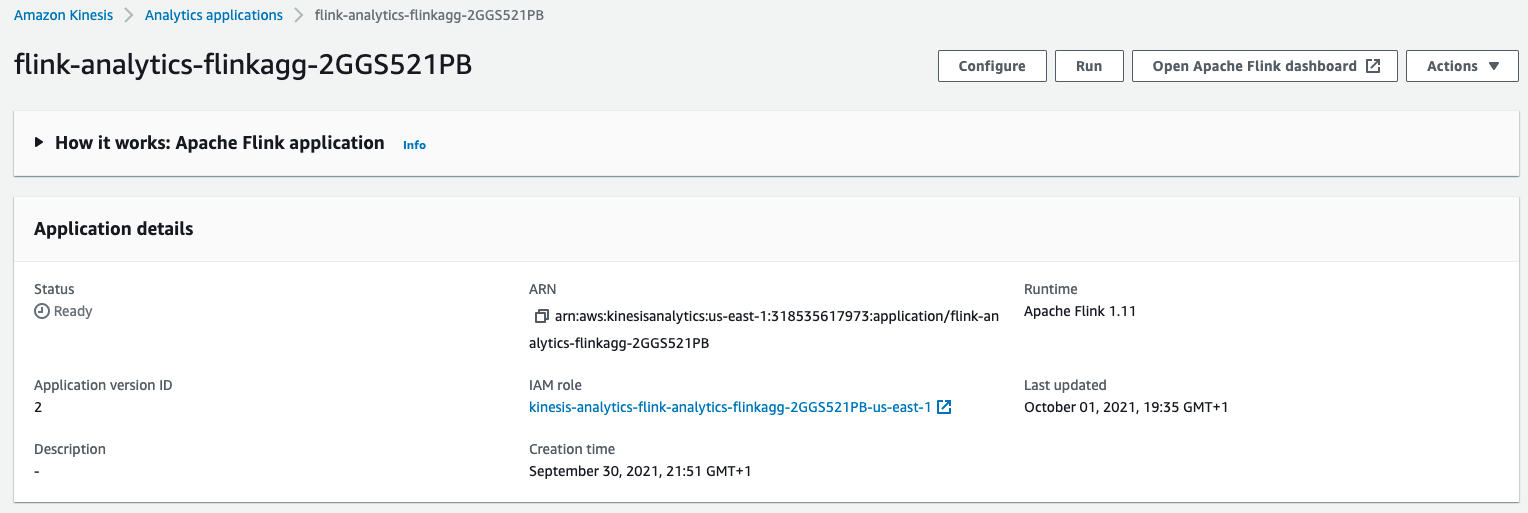
Now you can run your Flink application by clicking Run button. Once its in Running state you can open Flink Dashboard to monitor the status of your job.
Testing the application
As we did in the previous lab, we will test the running Flink application using the producer and consumer applications.
-
In the Cloud9 development environment, run the producer to start emiting sensor data to the stream.
./producer -
Now, use the command line consumer to view messages from the Kinesis stream to see the aggregated data being sent every minute.
-
In a second terminal session, run the consumer to start reading sensor data from the stream. It can take up to a minute for the first message to appear, since the Analytics application aggregates the messages in one minute intervals.
./consumer -stream wildrydes-summaryThe consumer will print the messages being sent by the Kinesis Data Analytics application every minute:
{
    "Name": "Shadowfax",
    "StatusTime": "2018-03-18 03:20:00.000",
    "Distance": 362,
    "MinMagicPoints": 170,
    "MaxMagicPoints": 172,
    "MinHealthPoints": 146,
    "MaxHealthPoints": 149
}
4. Experiment with the producer
Stop and start the producer while watching the dashboard and the consumer. Start multiple producers with different unicorn names.
✅ Step-by-step directions
-
Switch to the tab where you have your Cloud9 environment opened.
-
Stop the producer by pressing Control + C and notice how the consumer stops receiving messages.
-
Start the producer again and notice the messages resume.
-
Hit the (+) button and click New Terminal to open a new terminal tab.
-
Start another instance of the producer in the new tab. Provide a specific unicorn name and notice data points for both unicorns in consumer’s output:
./producer -name Bucephalus -
Verify you see multiple unicorns in the output:
{
    "Name": "Shadowfax",
    "StatusTime": "2018-03-18 03:20:00.000",
    "Distance": 362,
    "MinMagicPoints": 170,
    "MaxMagicPoints": 172,
    "MinHealthPoints": 146,
    "MaxHealthPoints": 149
}
{
    "Name": "Bucephalus",
    "StatusTime": "2018-03-18 03:20:00.000",
    "Distance": 1773,
    "MinMagicPoints": 140,
    "MaxMagicPoints": 148,
    "MinHealthPoints": 132,
    "MaxHealthPoints": 138
}
⭐ Recap
🔑 Amazon Kinesis Data Analytics enables you to query streaming data or build entire streaming applications using SQL, so that you can gain actionable insights and respond to your business and customer needs promptly.
🔧 In this module, you’ve deployed a previously developed Kinesis Data Analytics application that reads from the Kinesis stream of unicorn data and emits a summary row each minute. The application runs in a stand-alone mode, so that you don’t require a running Studio Notebook used during the development phase.
Next
✅ Depending on your time or interest you can proceed to Data Lake, wherein you’ll deliver the raw stream data from the Kinesis stream to Kinesis Data Firehose for delivery to Amazon S3 and use Amazon Athena to query that raw data.