Implement the Stream Aggregation
Implement the Streaming Aggregation
1. Create a Kinesis Data Stream for the summarized events
Use the Amazon Kinesis Data Streams console to create a new stream named wildrydes-summary with 1 shard. This stream will serve as destination for our Kinesis Data Analytics application.
A Shard is the base throughput unit of an Amazon Kinesis data stream. One shard provides a capacity of 1MB/sec data input and 2MB/sec data output. One shard can support up to 1000 PUT records per second. You will specify the number of shards needed when you create a data stream. For example, if we create a data stream with four shards then this data stream has a throughput of 4MB/sec data input and 8MB/sec data output, and allows up to 4000 PUT records per second. You can monitor shard-level metrics in Amazon Kinesis Data Streams and add or remove shards from your data stream dynamically as your data throughput changes by resharding the data stream.
✅ Step-by-step Instructions
-
Go to the AWS Management Console, click Services then select Kinesis under Analytics.
-
Click Get started if prompted with an introductory screen.
-
Click Create data stream.
-
Enter
wildrydes-summaryinto Data stream name, select the Provisioned mode, and enter1into Number of open shards, then click Create Kinesis stream. -
Within 60 seconds, your Kinesis stream will be ACTIVE and ready to store real-time streaming data.
2. Create an Amazon Kinesis Data Analytics application
In this step, we are going to build an Amazon Kinesis Data Analytics application which reads from the wildrydes stream built in the Real-time Data Streaming module and emits a JSON object with the following attributes for each minute:
| Name | Unicorn name |
| StatusTime | ROWTIME provided by Amazon Kinesis Data Analytics |
| Distance | The sum of distance traveled by the unicorn |
| MinMagicPoints | The minimum data point of the MagicPoints attribute |
| MaxMagicPoints | The maximum data point of the MagicPoints attribute |
| MinHealthPoints | The minimum data point of the HealthPoints attribute |
| MaxHealthPoints | The maximum data point of the HealthPoints attribute |
To do so, we will use Kinesis Data Analytics to run an Apache Flink application. To enhance our development experience, we will use Studio notebooks for Kinesis Data Analytics that are powered by Apache Zeppelin.
Kinesis Data Analytics provides the underlying infrastructure for your Apache Flink applications. It handles core capabilities like provisioning compute resources, parallel computation, automatic scaling, and application backups (implemented as checkpoints and snapshots). You can use the high-level Flink programming features (such as operators, functions, sources, and sinks) in the same way that you use them when hosting the Flink infrastructure yourself. You can learn more about Amazon Kinesis Data Analytics for Apache Flink by checking out the corresponding developer guide.
✅ Step-by-step directions
-
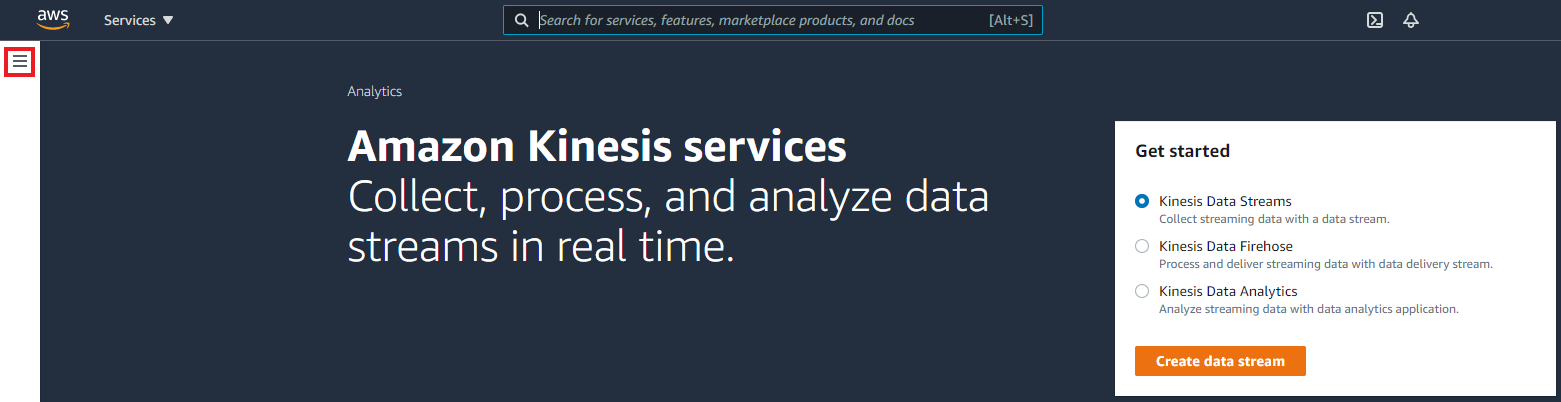
In the AWS Management Console, click Services, select the Kinesis service under Analytics
-
Choose the Analytics Applications tab in sidebar on the left. If you cannot see a sidebar on the left, please click the Hamburger icon (three vertical lines) to open it.
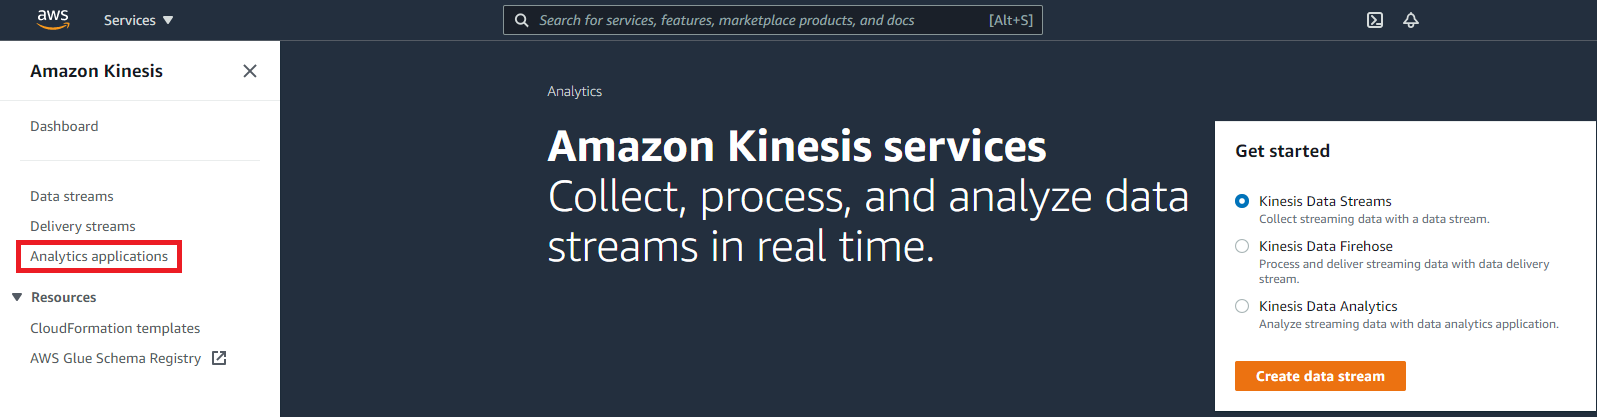
-
Select the Studio tab
-
Click the Create Studio Notebook button. Keep the creation method to the default value.
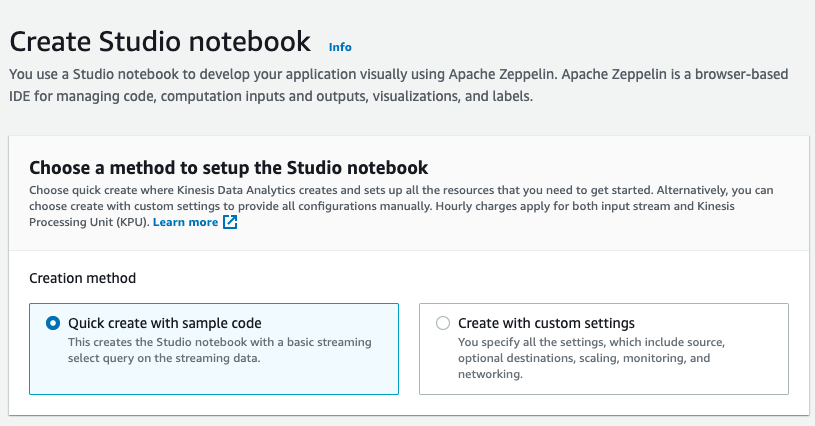
-
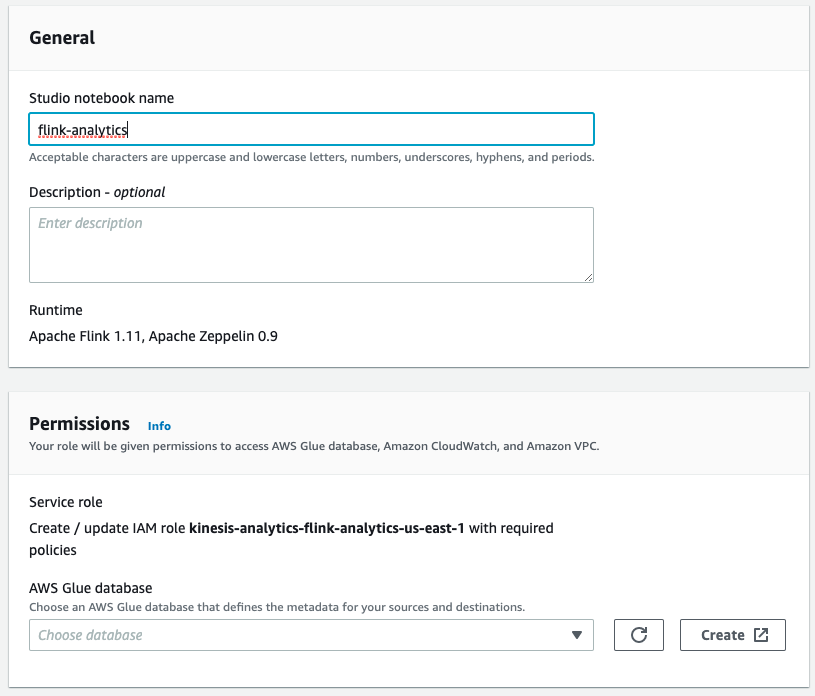
Name the notebook
flink-analytics -
In the Permissions panel, click the Create button to create a new AWS Glue database. The AWS Glue service console will open in a new browser tab.
-
In the AWS Glue console, create a new database named
default. -
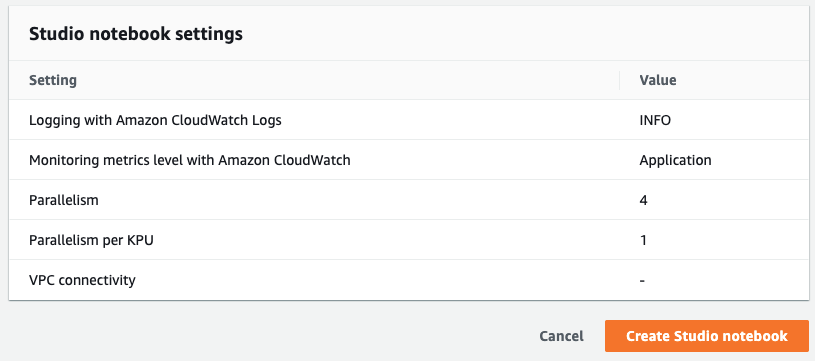
Switch back to your tab with the Studio notebook creation process and click Create Studio notebook.
-
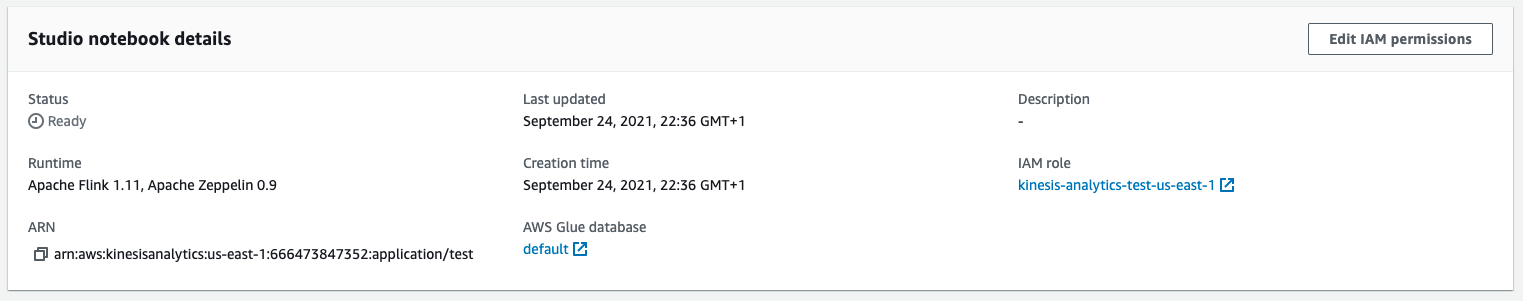
Once the notebook is created, click the Edit IAM permissions button in the Studio notebook details section.
-
Make sure to select the
defaultdatabase in the AWS Glue database dropdown. Click the Choose source button in the Included sources in IAM policy section.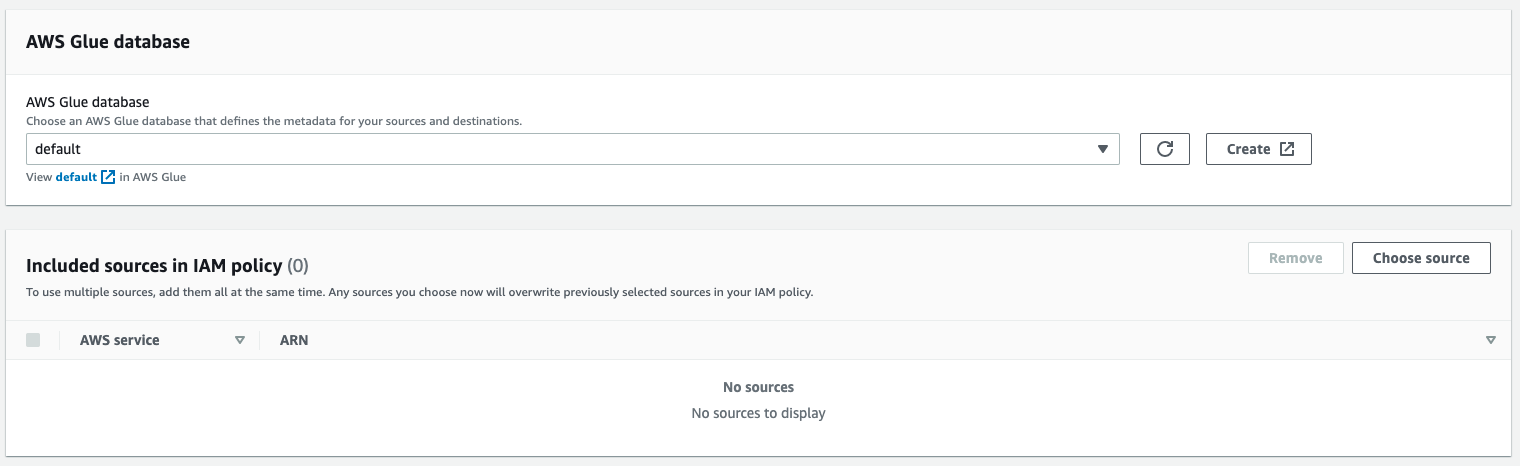
-
Click Browse to select the
wildrydesKinesis data stream as a source. Afterwards, click Save changes.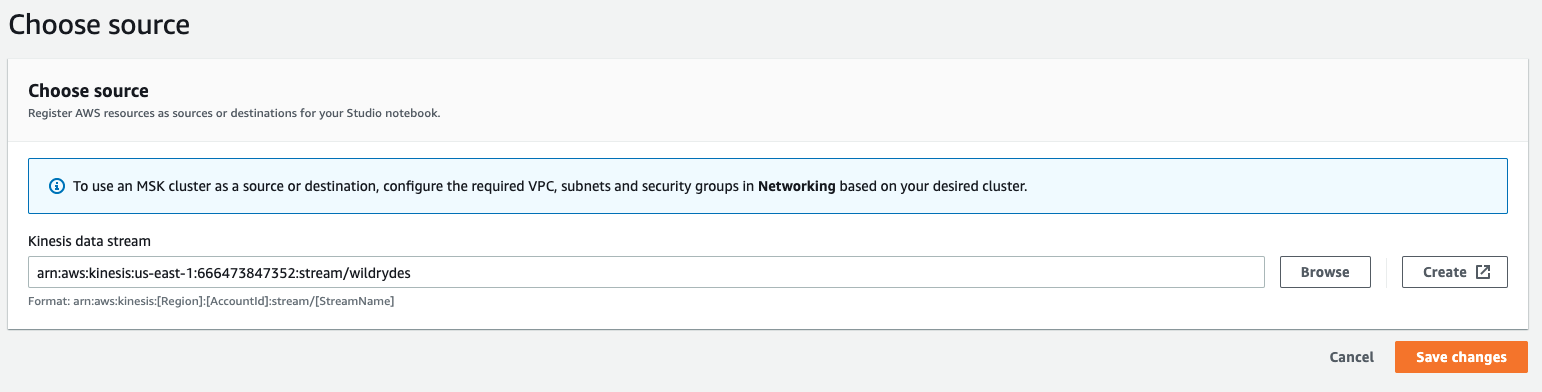
-
Click Choose destination followed by Browse to select the
wildrydes-summaryKinesis data stream as a output. Afterwards, click Save changes.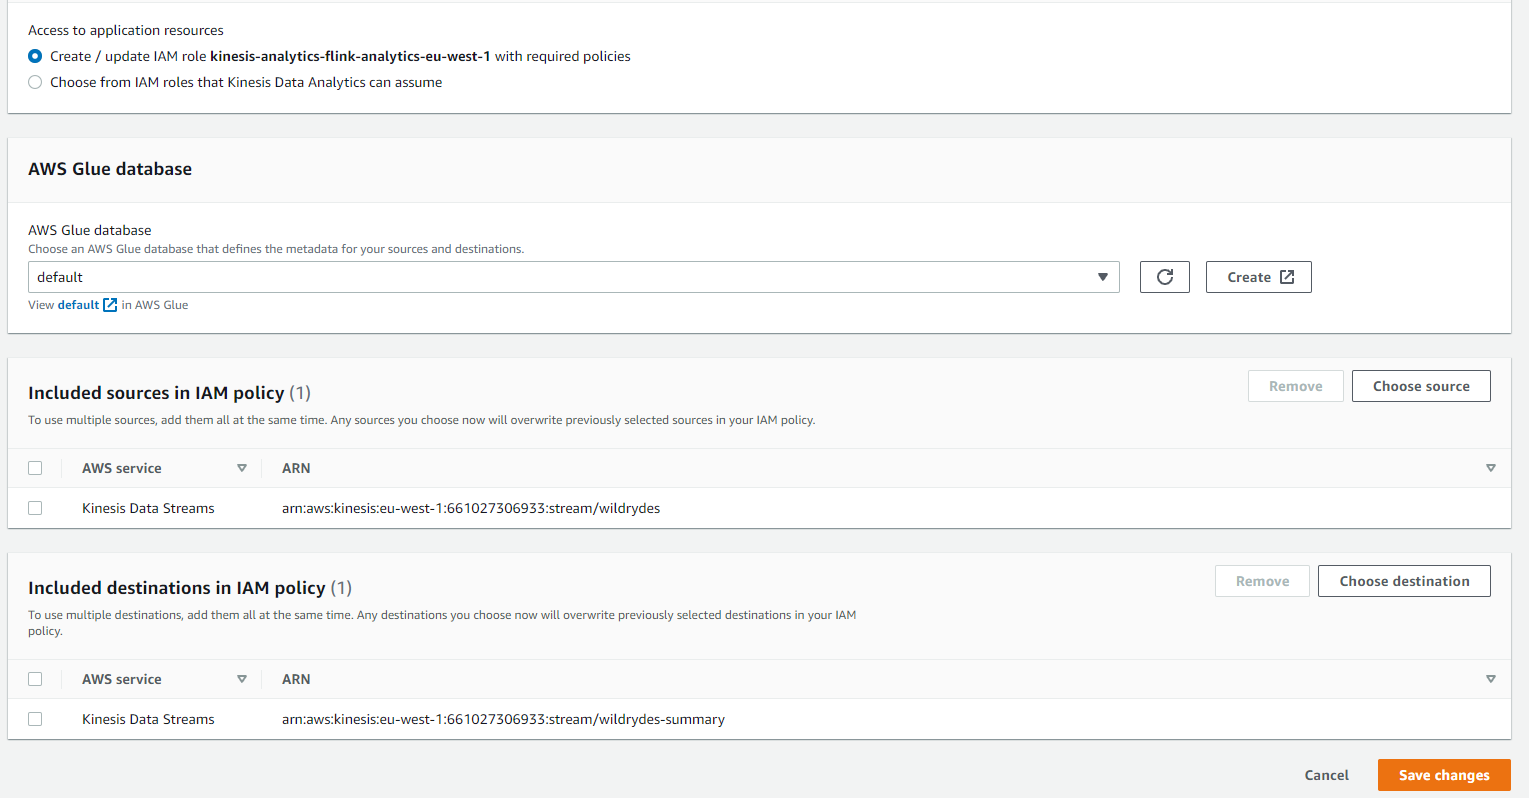
-
Click Save changes the second time to update the IAM policy.
-
Click on IAM Role link to open it in separate tab. We need to add an additional managed policy to the role that would allow us to delete Glue tables. And we will reuse this policy when deploying the notebook as Flink application later.
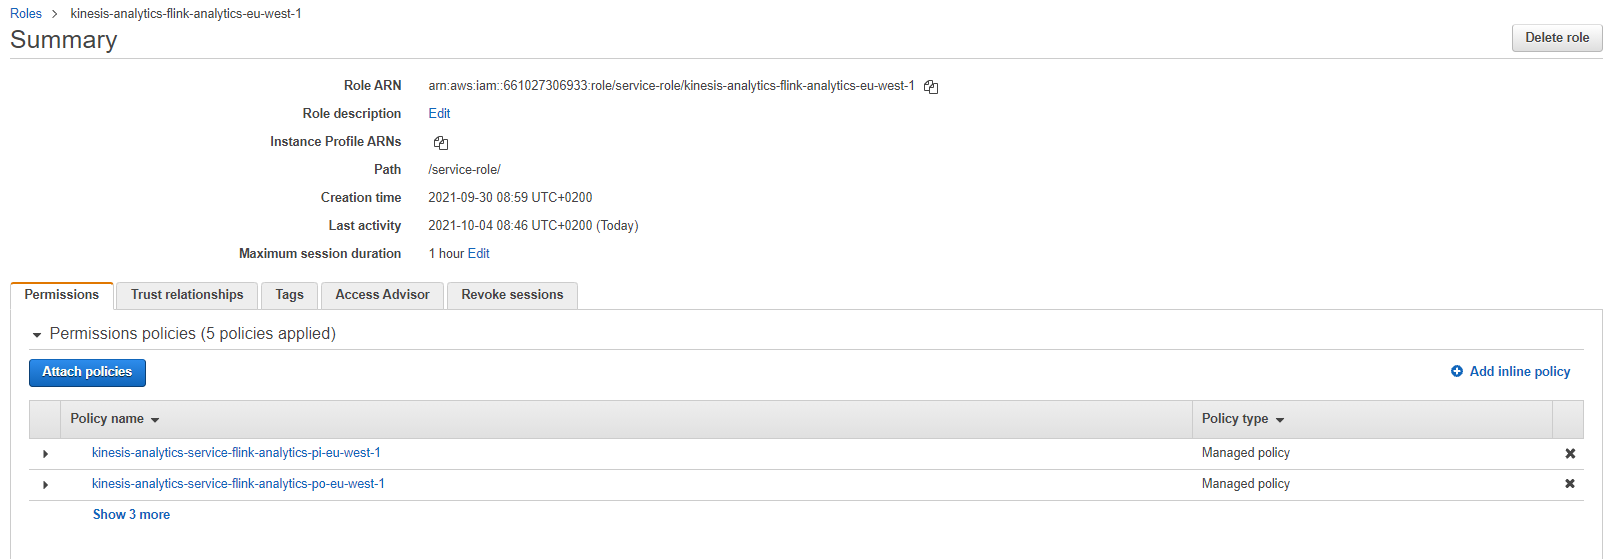
-
Click Add permissions, then Attach Policies, and then Create Policy. Use the Visual editor. Choose
Glueas Service. -
For the Actions, select
GetPartitionsfrom the Read subsection andDeleteTablefrom the Write subsection. -
For the Resources, click Add ARN for catalog and enter your region (e.g.
eu-west-1) -
For the database, click Add ARN, enter your region and specify
defaultfor database name -
Finally, for the table, click Add ARN, enter your region, specify
defaultas database, and select Any for the Table name.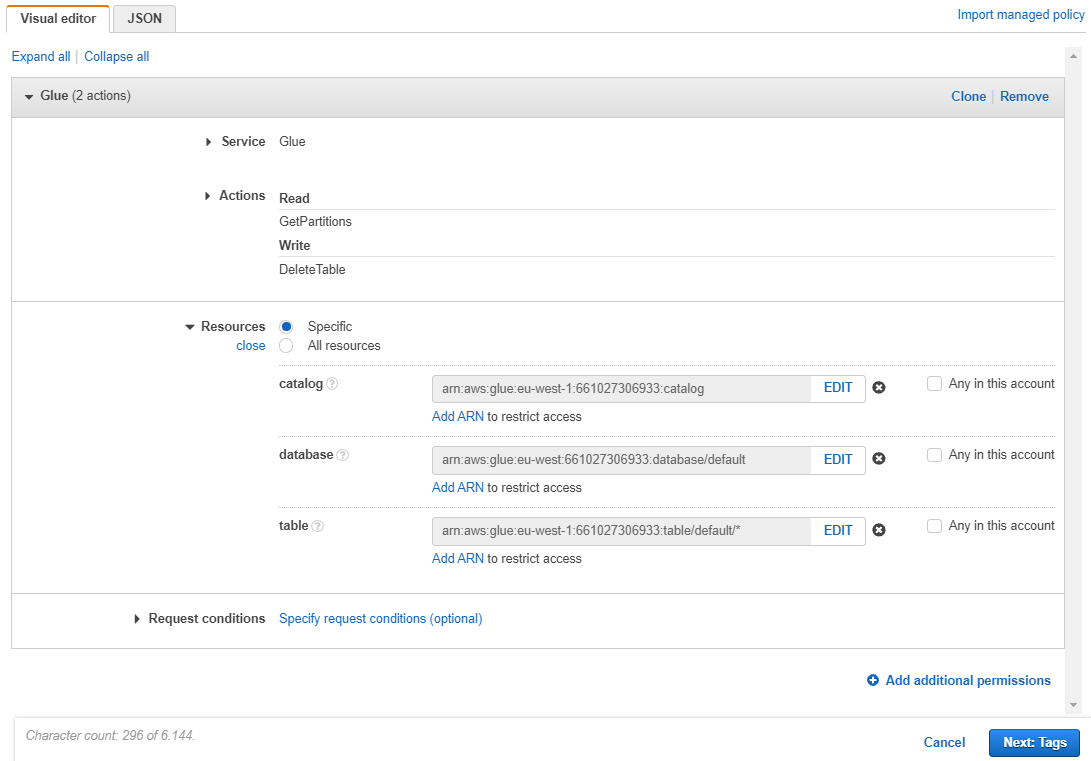
-
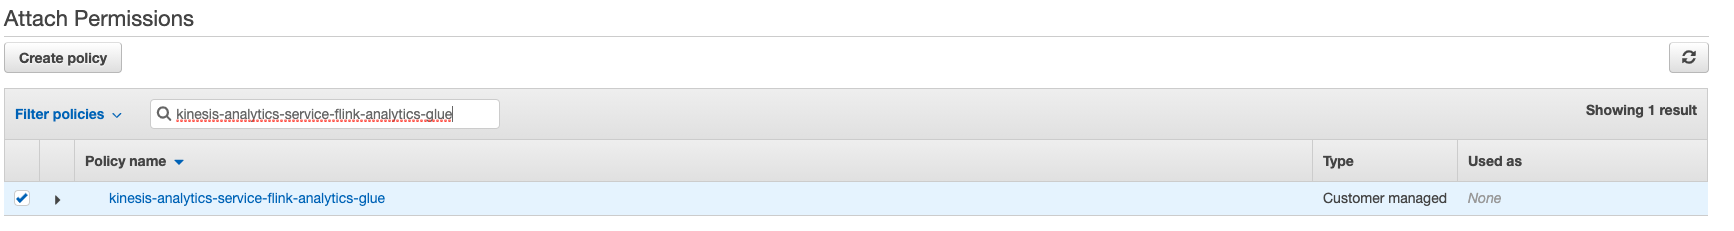
Click Next: Tags button and then Next: Review. Specify
kinesis-analytics-service-flink-analytics-glueas the policy name and click Create Policy button. -
Attach the policy you have just created to the notebook IAM role, by selecting it from the list and clicking Attach Policy button.
-
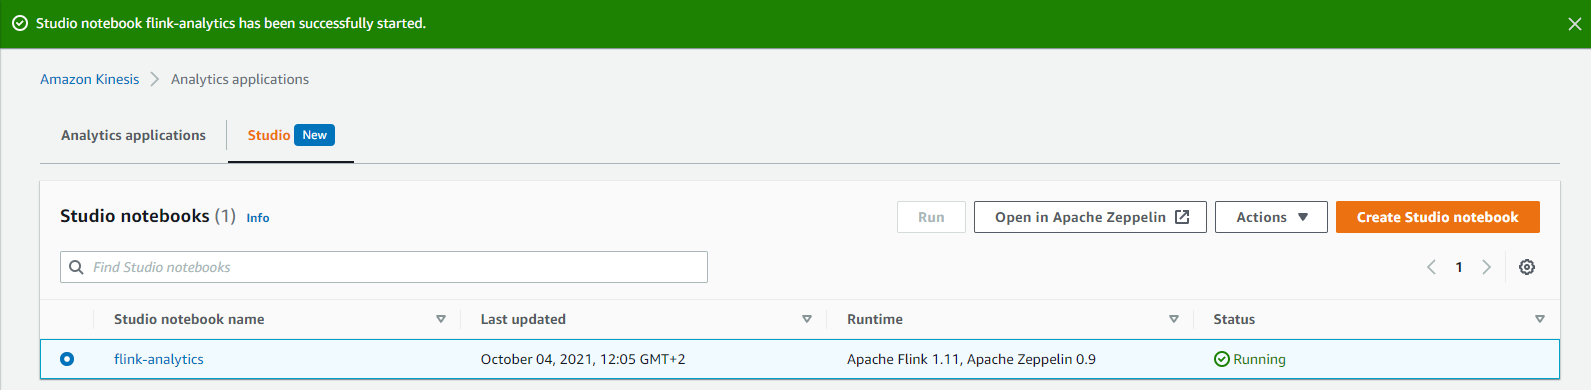
Switch back to KDA Studio notebook tab and click Run to run the notebook. As soon it is in the Running state (takes a few minutes), click the Open in Apache Zeppelin button.
-
In the Apache Zeppelin notebook, choose create a new note. Name it
flinkaggand insert the following SQL command. Replace the<REGION>placeholder with the actual region (e.g.eu-west-1).%flink.ssql(type=update) DROP TABLE IF EXISTS wildrydes; CREATE TABLE wildrydes ( Distance double, HealthPoints INT, Latitude double, Longitude double, MagicPoints INT, Name VARCHAR, StatusTime AS proctime() ) WITH ( 'connector' = 'kinesis', 'stream' = 'wildrydes', 'aws.region' = '<REGION>', 'scan.stream.initpos' = 'LATEST', 'format' = 'json' ); DROP TABLE IF EXISTS wildrydes_summary; CREATE TABLE `wildrydes_summary` ( Name VARCHAR, StatusTime TIMESTAMP, Distance double, MinMagicPoints INT, MaxMagicPoints INT, MinHealthPoints INT, MaxHealthPoints INT ) WITH ( 'connector' = 'kinesis', 'stream' = 'wildrydes-summary', 'aws.region' = '<REGION>', 'scan.stream.initpos' = 'LATEST', 'format' = 'json' ); INSERT INTO `wildrydes_summary` SELECT Name, TUMBLE_START(StatusTime, INTERVAL '1' MINUTE) AS StatusTime, SUM(Distance) AS Distance, MIN(MagicPoints) AS MinMagicPoints, MAX(MagicPoints) AS MaxMagicPoints, MIN(HealthPoints) AS MinHealthPoints, MAX(HealthPoints) AS MaxHealthPoints FROM wildrydes GROUP BY TUMBLE(StatusTime, INTERVAL '1' MINUTE), Name; -
Execute the code by clicking the
Playbutton next to the READY statement on the right side of the cell.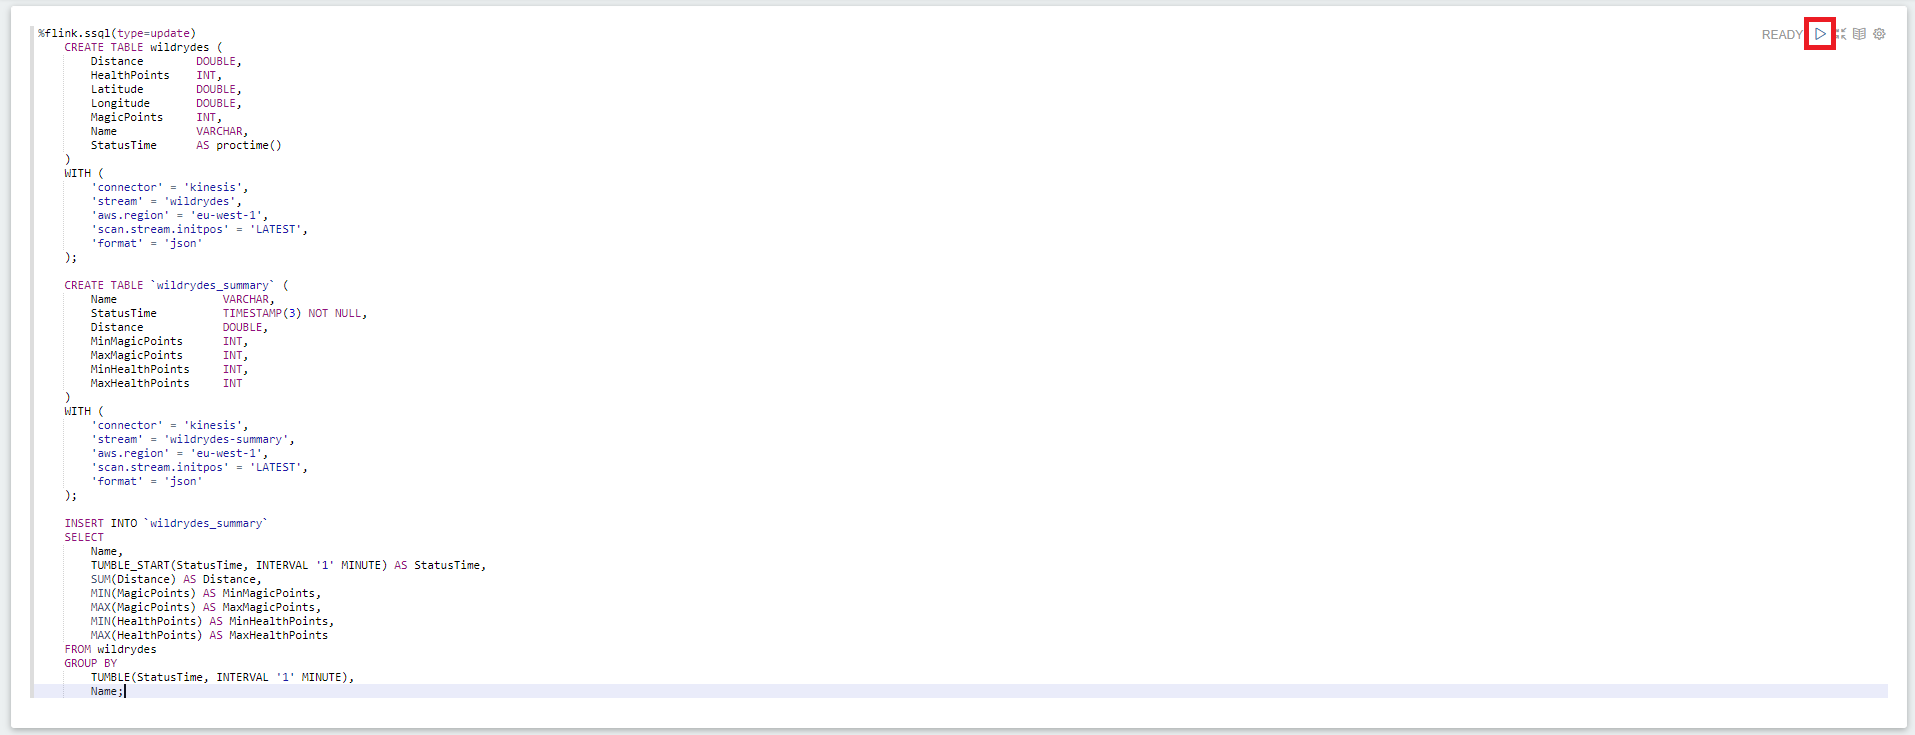
-
In the Cloud9 development environment, run the producer to start emiting sensor data to the stream.
./producer
3. Read messages from the stream
Use the command line consumer to view messages from the Kinesis stream to see the aggregated data being sent every minute.
✅ Step-by-step directions
-
Switch to the tab where you have your Cloud9 environment opened.
-
Run the consumer to start reading sensor data from the stream. It can take up to a minute for the first message to appear, since the Analytics application aggregates the messages in one minute intervals.
./consumer -stream wildrydes-summaryThe consumer will print the messages being sent by the Kinesis Data Analytics application every minute:
{
    "Name": "Shadowfax",
    "StatusTime": "2018-03-18 03:20:00.000",
    "Distance": 362,
    "MinMagicPoints": 170,
    "MaxMagicPoints": 172,
    "MinHealthPoints": 146,
    "MaxHealthPoints": 149
}
4. Experiment with the producer
Stop and start the producer while watching the dashboard and the consumer. Start multiple producers with different unicorn names.
✅ Step-by-step directions
-
Switch to the tab where you have your Cloud9 environment opened.
-
Stop the producer by pressing Control + C and notice how the consumer stops receiving messages.
-
Start the producer again and notice the messages resume.
-
Hit the (+) button and click New Terminal to open a new terminal tab.
-
Start another instance of the producer in the new tab. Provide a specific unicorn name and notice data points for both unicorns in consumer’s output:
./producer -name Bucephalus -
Verify you see multiple unicorns in the output:
{
    "Name": "Shadowfax",
    "StatusTime": "2018-03-18 03:20:00.000",
    "Distance": 362,
    "MinMagicPoints": 170,
    "MaxMagicPoints": 172,
    "MinHealthPoints": 146,
    "MaxHealthPoints": 149
}
{
    "Name": "Bucephalus",
    "StatusTime": "2018-03-18 03:20:00.000",
    "Distance": 1773,
    "MinMagicPoints": 140,
    "MaxMagicPoints": 148,
    "MinHealthPoints": 132,
    "MaxHealthPoints": 138
}
⭐ Recap
🔑 Amazon Kinesis Data Analytics enables you to query streaming data or build entire streaming applications using SQL, so that you can gain actionable insights and respond to your business and customer needs promptly.
🔧 In this module, you’ve created a Kinesis Data Analytics application that reads from the Kinesis stream of unicorn data and emits a summary row each minute.
Next
✅ Depending on your time or interest you can proceed to Deploy Flink Application to learn how to convert your notebook into full-fledged Flink analytics application.
✅ Depending on your time or interest you can proceed to Data Lake, wherein you’ll deliver the raw stream data from the Kinesis stream to Kinesis Data Firehose for delivery to Amazon S3 and use Amazon Athena to query that raw data.